
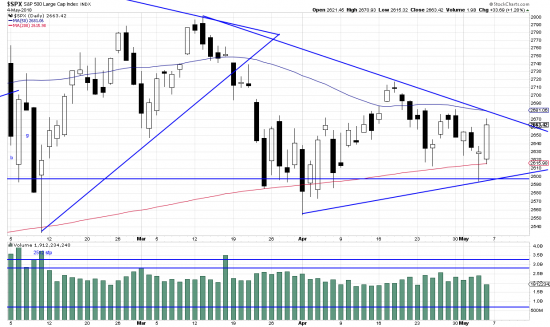
Here is the standard chart, and there are a number of ways to look at it. However you look at it it is an unruly octagon shape looking for a square hole. Most unusual — a triangle developing off a triangle. Another way to look at it is as a developing downwave. However you look at it it doesn’t look inviting and the volatility during this period is definitely not inviting. One way to deal with such unruliness is to define the borders of the formation and just stay away from the nastiness until prices clearly signal that the naked mud wrestling is over.
Another way to look at it is as a large descending triangle:
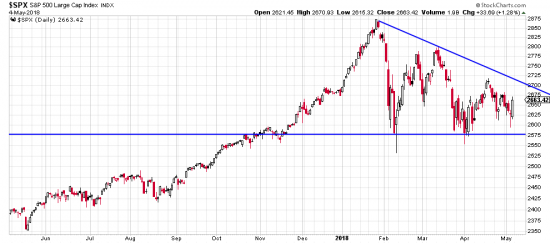
Here price action can be construed as a large descending triangle in the SPX.
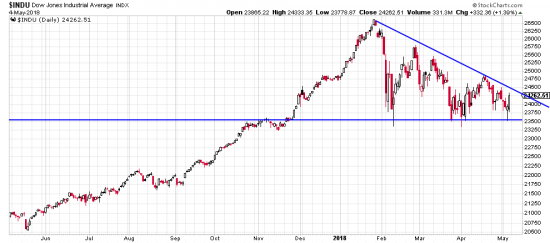
In the INDU a similar pattern.
In both of the indices the large descending triangle appeaars — not perfect, unruly but clearly identifiable.
To remind you, among reversing formations the descending triangle is analyzable as advertising its outcome: that is downwave. Given the volatility one can see not participating. In fact one can see not participating until the lines drawn here are clearly taken out. We would be suspicious of upside breakouts.