
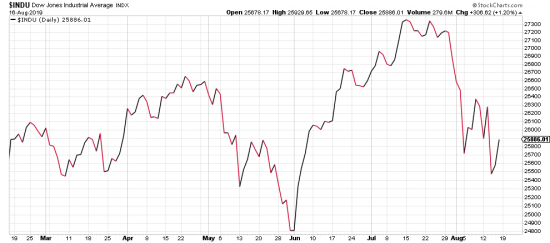
A line chart which shows the volatility close to close. The recent days have been in some cases historic and bizarre. So much so that we made a note of the daily ranges, which are to say the least, unusual: 562 (7/31), 626, 735, 632, 345, 354, 593, 536, 564, 593, 1300 (closed down about 800 (that is) 3% a historic record). Looked at from a different perspective:

Even if you are not made seasick there are other reasons to look askance at this market. Namely we are in a pattern which may presage even more distress. It is not our practice to “recommend” stocks or positions. Rather we analyze the markets and inform our readers as to favorable and unfavorable trend conditions. The result being obvious, that one invests with the trend, bullish or bearish. And adjusts his portfolio according to the trend and the strength of the trend.
At present we may well have broken, or at least have thrown into doubt the historic Obama trend from 2009. As always the market condition is ambiguous and subject to interpretation and investors must factor in uncertainty. Then the level of perceived risk versus reward must be evaluated. Trend direction and volatility — as well as, for example, political and economic conditions — are the major factors in determining risk. At present we are in a downwave with fearsome volatility.
For our own accounts our positions are the smallest they have been since 2009, a very little AAPL, AMZN, UPRO.