
In Wonderland, as Alice discovered, the normal laws (as gravity) do not work as they do on the outside. This has resulted in a pandemic of pundits and a howling mob of talking heads eager to be the one who calls the market turn. These mob scenes do nothing but muddy the waters. In order to unmuddy the waters we do what we always do–analyze the chart.
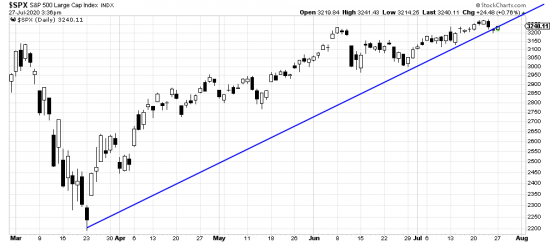
At the end of the chart there is a promising bearish downgap but its bearish implications are almost immediately canceled as it is covered today. And so at the moment it seems we are looking at nothing more than the end of a profitable wavelet that started 6/11 (30 days 9.19% 275 points). The chart does not say so, but prudent practice dictates that purchases here are in very risky territory. In fact one might want to evaluate the risks here and prune back his (her) position. For example the long term stop is at 2786.
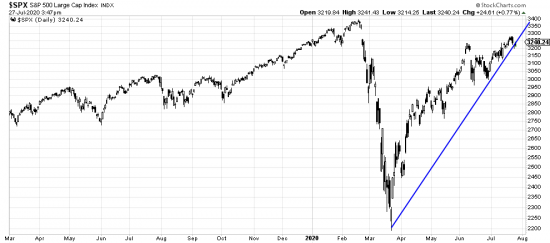
Meantime the long term state of the market remains bullish with intermitant volatility hurricanes. Keeping in mind the virus and the virus countering motions by Congress and the unpredictable White House.
An unbelievable market, but then how often do you get worldwide plagues?