 http://stockcharts.com/h-sc/ui?s=$SPX&p=D&yr=0&mn=6&dy=0&id=p97142210271&a=214966864
The general market environment has deteriorated over the past few days. In the SPX a new pattern appears to be emerging– namely a lower high and a lower low. At the moment this lower low is razor thin –.64 as compared to .53, but the alert is there. In addition the SEpt-Oct pattern has a toppy look. It appears something like a double top on a very minor scale — is not by definition as it is too short a time scale. The implications of this formation are not significant at this time — about 40 points but it is never wise to relax your vigilance.
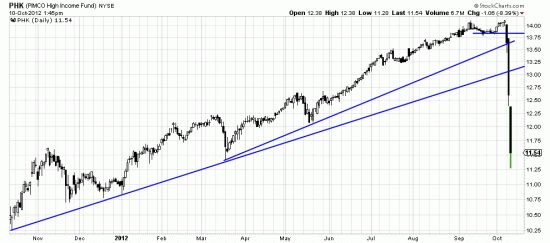
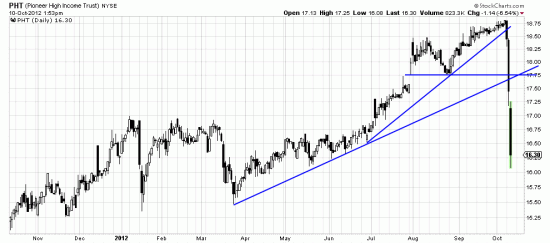
A mood change may be occurring. If you want to see some dramatic charts look at these. (We have been nattering on about the coming implosion of the bond market for some time and are in fact short the TLT.) Pimco hit a severe downdraft as seen in the charts.)
 http://stockcharts.com/h-sc/ui?s=PHK&p=D&yr=1&mn=0&dy=0&id=p20005832697&a=280104558
 http://stockcharts.com/h-sc/ui?s=PHT&p=D&yr=1&mn=0&dy=0&id=p18221294605&a=280104919
PHK and PHT. And don’t even think about buying these issues until a clear bottom is in. This is the “get your fingers cut by the falling knife” phenomenon.

