
The market continues to do what the market does — that is, it obeys the law that the present trend tends to continue. Since the present trend is sideways it continues to grind sideways. For all intents and purposes the sidewinder started in January. Close Dow Jan 1 16441. Close Friday 16583. Not counting the nasty little downwave in January. During this time the bio-techs and techs have taken it in the ear and technicians and worry warts have fretted (frotted?) over the weakening of market indicators. Investors, spooked by all the top chatter have bid up the bonds and appear to be liquidating small caps and plowing the money into the majors. Well, as the car insurance ad says, everybody knows that. What do we know that they don’t?
We know that there are some very toppy looking patterns out there.

http://stockcharts.com/h-sc/ui?s=QQQ&p=D&yr=1&mn=0&dy=0&id=p71514206946&a=350515648
We may be looking at a head and shoulders here in the Qs. The features marked. If the horizontal line is taken out we will certainly take the short. Good practice advises that the pattern should be allowed to complete itself, rather than trying to get a good price.
The IWM is similarly situated. The pattern is not as classic as the Qs, but is indicative of the state of the market.
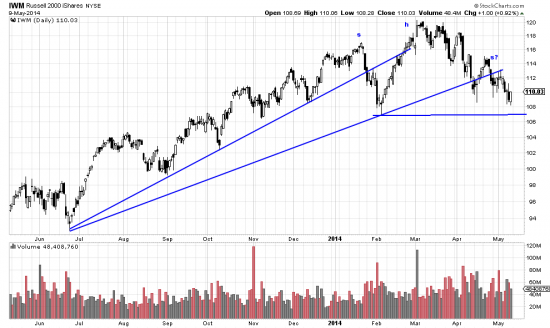
http://stockcharts.com/h-sc/ui?s=IWM&p=D&yr=1&mn=0&dy=0&id=p42567425598&a=350518198
As if the pattern weren’t bad enough the broken trendlines are a warning of further deterioration.
These patterns and the continuing continuation of the sidewave do not augur well for the general market. And yet, the Dow closed at an all time high, the PnF charts are brimming with confidence and throwing off buy signals. One thing is for sure — This market is building up pressure like a stopped up volcano. When it blows it’s going to get lava all over everything.