
http://stockcharts.com/h-sc/ui?s=$SPX&p=D&yr=0&mn=9&dy=0&id=p83750808625&a=214966864
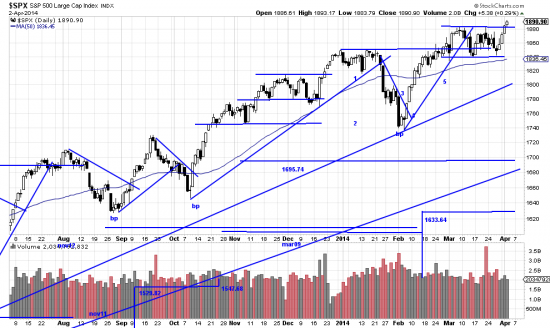
SPX prices finally got it together to escape from the rectangle. The breakout bars were nothing impressive, but who are we to look new highs in the mouth. If this is progress (it is) it comes at the expense of many hen’s teeth and in the teeth of warnings about the 1929 chart, the 1987 chart, the probable 30% downtrend, the erectile dysfunction of Congress, the belligerence of Czar Putin…and, oh, lots of stuff.
http://stockcharts.com/h-sc/ui?s=$SPX&p=D&yr=0&mn=3&dy=0&id=p96206718625&a=214966864
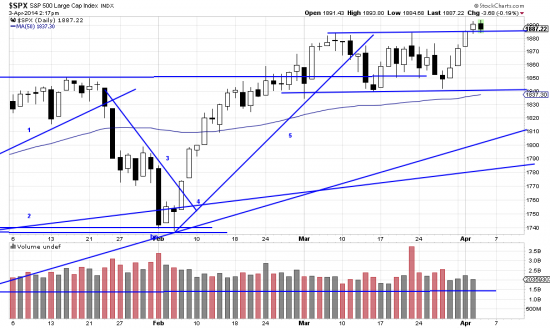
Ordinarily we might well add on here but the lackluster bars leave us uninspired so we will wait for a confirmation power bar to add on. Many other analysts have gone all in for the new high and we don’t really blame them, but we know that contrarians still have enormous power in this market.
We have spoken of the election year correction which we still expect but we think there will be another wave up before that occurs. This is not a prediction, nor an analysis, just moderately informed noodling. It seems to us that the last few weeks have built up something of a base – a technical base and a frustration base for those watching hungrily from the sidelines.
Big money is moving around. According to report $52B fled PIMCO over the last 11 months. Nothing bothers investors more than hot money looking for a home (returns). Like a hot potato it burns holes in the pockets of managers. We recorded quite a while ago our exit from the bond markets and we remain negative about them. When they crack we will be there to profit from those who think asset allocation demands that you be long a declining market.
http://stockcharts.com/h-sc/ui?s=GLD&p=D&yr=0&mn=9&dy=0&id=p79177025382&a=255869372
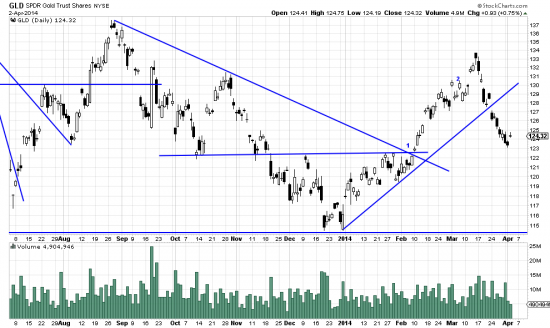
Speaking of gold….If you looked hard you might interpret a double bottom in GLD and the market had a run up — a wave which ended with an island reversal and then gapped across the short term trendline. Certainly from the trading perspective the wave is over and we don’t see a trend buy there yet.
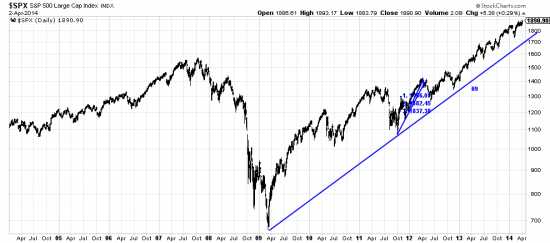
Back in about April of 2012 we published the following chart. We took the first wave up from the correction and computed possible targets for the market using the rule of seven (http://www.edwards-magee.com/ggu/ruleofseven.pdf). Readers will see them here and readers will see that the targets were hit and exceeded and wonder whether in fact our disavowal of predictive skill is just false modesty. We don’t guide our analysis using these tools – they are auxiliary techniques but they have proven to be unusually prescient. We are now looking for the crystal ball we used then and when we find it we will have other noodlings.
http://stockcharts.com/h-sc/ui?s=$SPX&p=D&yr=10&mn=3&dy=0&id=p46146029187&a=254727527
The targets calculated at that time were 1456.07, 1582.45, and 1837.38. Shortly we will publish the results of more crystal ball gazing.