
http://stockcharts.com/h-sc/ui?s=%24SPX&p=D&yr=0&mn=9&dy=0&id=p70901721466&a=266398464
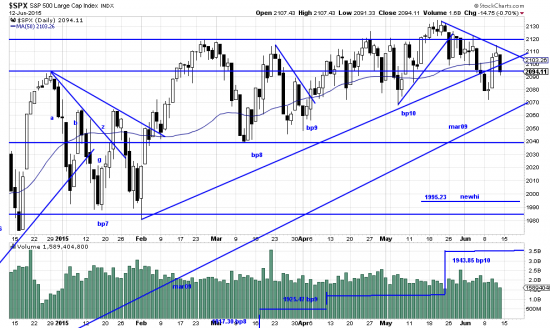
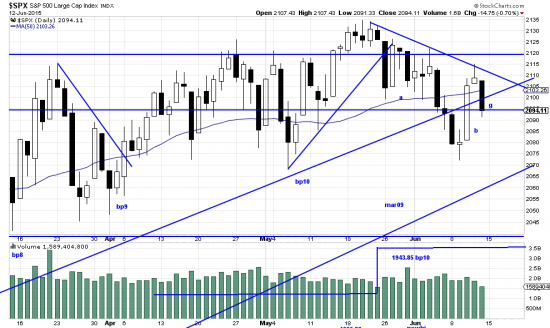
We now have a recognizable pattern in the SPX. It is the alpha-beta-gamma pattern. (http://www.edwards-magee.com/ggu/alphabetazetawaves.pdf) A close-up:
http://stockcharts.com/h-sc/ui?s=%24SPX&p=D&yr=0&mn=9&dy=0&id=p70901721466&a=266398464
One could quibble with the marking of the waves here. Perhaps the first upthrust after “a” is the b marker, but as marked seems more likely and is easier to analyze. If this is accurate the last bar is the beginning of the gamma wave. This is the wave to test the previous low. On the downside taking out that low would be damaging to the bull trend — Given that contrarians are running the market it is likely that traders will maintain the market between 2050 and 2135 until something more dramatic happens.
Withal, we remain bullish and remind you that the market likes to take zig-zag down before powering up in order to wipe out the unwashed and unworthy. The chart will tell us when this has been accomplished.