
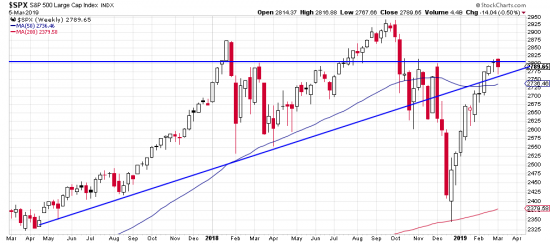
Here a two year weekly chart of the SPX. The horizontal line gains resistance strength in the present by referring to this same level in 2018. We have speculated on the possibility that the entire formation might be a bastard type double top, but that is probably not necessary to explain the present situation — except insofar as all market patterns are interwoven and generally quite complex. But right now the horizontal line says it all: resistance with attacks on it looking weak. We repeat ourselves: probably not a time to be buying. Best to wait and see who wins the fight here at resistance, but certainly a buy if this level is definitively overcome.

The daily chart illustrates the weakness of efforts to overecome resistance in the present moment. Nonetheless the length and strength of the present wave is impressive. We will shortly run the rule of seven on it, so stay tuned. It is interesting that the PnF analysis targets 3500. We will show that chart when we report on the rule of seven analysis.