http://stockcharts.com/h-sc/ui?s=%24SPX&p=D&yr=1&mn=0&dy=0&id=p96377812470&a=406885784
Not everything can be analyzed. But things which are not analysis can be analyzed. This is sort of like known knowns and known unknowns and unknown unknowns — well, you get the idea. The unanalyzed unknown here is the feeling of danger in the air. We are on the edge (razor’s) of danger, if not an explosion.
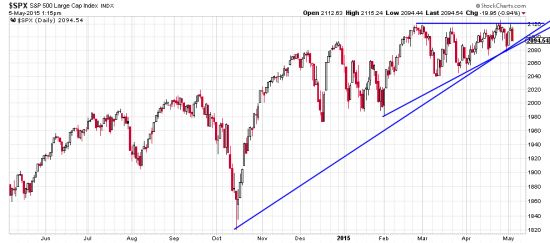
There is some basis for this unanalysis in the charts. The SPX looks like, perhaps, an ascending triangle. Sometimes this is called a coil, recognizing the fact that energy is coiling up and may uncoil or explode. Generally practice and observation say that prices tend to break out upwards. And like everything about the market there are as many exceptions as there are dependable rules. At the moment, as is traditional, the old highs are acting as resistance — and very stubbon resistance at that. Meaning the longer this breakout is delayed the more energetic it will be. This entire construct could dissolve into bear burgers with one lightning strike around the herd. (Ah, there’s a mixed metaphor for the unwary.) Stampede!
That’s what the context feels like — a restless and anxious herd trying to get through the night and a gathering storm. This is complicated by numerous Cassandras looking to make a reputation by calling the top and consorting with bears.
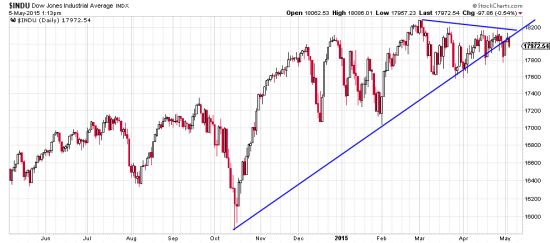
The Indu is stuck at resistance also.
http://stockcharts.com/h-sc/ui?s=%24INDU&p=D&yr=1&mn=0&dy=0&id=p04117083202&a=406885292
As seen a more ragged triangle in the Indu — This one less optimistic as the lows are not equally rising. Dow Theory analysts would call this a “line”. Whatever, this technical tension will not be relieved until the recent highs are taken out. It should be remembered that coils, or triangles, diminish in power as they work closer to the apex. That is, they can fizzle and leave the tension unresolved.
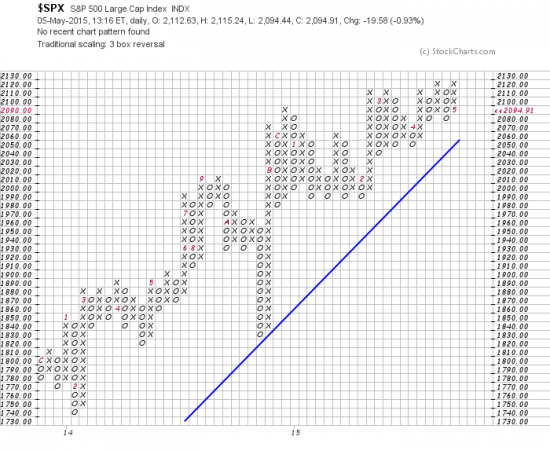
The implications of these formations can be estimated (if not unanalyzed) by looking at the PnF chart. That chart is essentially a way of measuring market forces.
http://stockcharts.com/freecharts/pnf.php?c=%24SP
As you are certain to remember, Wyckoff computed energy stored up in a sideways formation by counting across the formation, then multiplying by reversal size and then multiplying by box size. Here we counted 23 across (you could say that only the upper part of the formation should be counted. Looks like one humongus formation to us). Times 3 = 69. Times 10 = 690. Added to bottom of formation, 1990 = 2680. We don’t know whether we can keep the herd calm that long.
Feliz cinco de Mayo. Viva Mexico!


