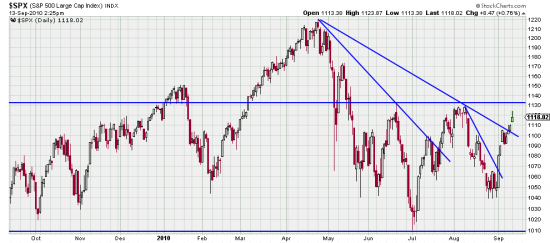
We have remarked at some length on the futility of pre-identifying chart patterns — as we have remarked here on everybody in the world seeing a head and shoulders here, and our pointing out that there may also be a Kilroy (H&S) bottom also formed from June to present.
In the little picture (which is where we all live) we now have an 11 day upwave of a bit more than 6% to go with the previous downwave of 15 days and somewhat more than 7%. This should go on for a few more days as it reaches the horizontal resistance line. We opine that prices will remain within the sideways pattern — in fact even if price did break out of this pattern it would just be entering a larger trading range. As you can see there is no trendline on this upwave. It is not yet possible to draw one since there has been no downwavelet to anchor it on.
Not until the April high is taken out will we have a confirmed bull market.
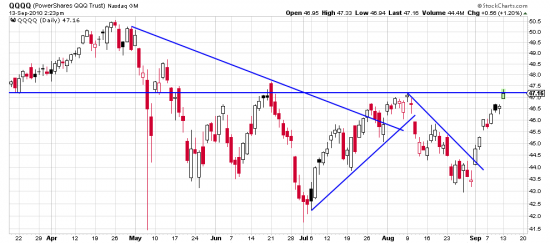
We got long the S&P, as noted on the power bar August 27, based on the breaking of the downtrend line on hourly charts. if we thought this was really a trend we would be adding on, but after 5 (m/l) months of chop we’re pretty wary.
We did add on by buying the Qs and as you see here it is surprisingly taking out the previous wave high. On this chart the 27th looks very like a reversal day.
You may have been noticing how much happier the news sounds lately — or perhaps we should say the tone is different. Do not be deceived. It’s the same news. It was just time to take the market in a different direction.
The last 6 upwaves have been in days, 54, 7, 10, 7, 15, 11. The downwaves have been 22,4, 10, 6, 15. In this context an extension of the present upwave would be mildly surprising and somewhat bullish.
But don’t get your hopes up. We are about to be buried in political guano until early November.


