
 http://stockcharts.com/h-sc/ui?s=$SPX&p=D&yr=0&mn=9&dy=0&id=p09343555801&a=214966864
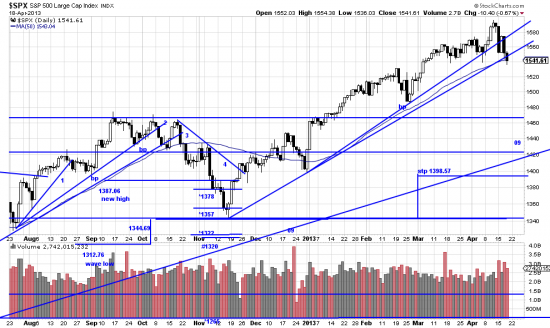
The uppermost (77 day, 12/31/12) trendline looks to be broken and the 109 day (11/16/12) is cracking. We say looks to be because in Magee’s opinion a trendline had to be broken by 3% to be a valid break. Being the little boy who always disobeyed and colored outside the lines we start hedging early. You could also fudge (or nudge) the system by using the top bar as a new high bar and using the low as a basing point, or, 1586 bp, stp 1490.84 (6% filter). Otherwise the wave low stop as drawn is 1398.57 m/l. The likelihood of the march 09 being broken here (and there cannot be a bear market without its breaking) looks to be slim and none. But fair warning the shorter trendlines are falling. Once the breaks are confirmed a downwave is a certainty. Due to the comparatively short length we expect a shallow downwave.
Kilroy setup. They will say flash crash spite of computer problems.