
 http://stockcharts.com/h-sc/ui?s=$SPX&p=D&yr=0&mn=9&dy=0&id=p34555890157&a=214966864
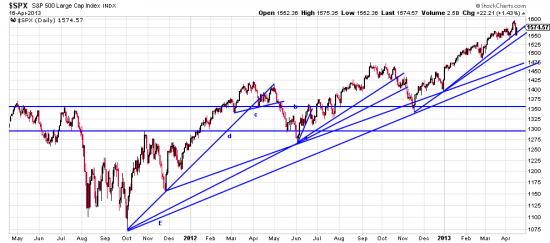
Back during the bungee markets of Jul-Dec 2011 We compared the markets to drunken squirrels running up and down a tree. It is entirely possible that we are entering a period like that considering that we now have three days of bungee markets, the Dow moving in triple digits each day. That previous period punitively punished our equity as we attempted to hedge and were constantly whipsawed. Which just happened in the present markets We were hedged, lifted the hedge (losing a little) and today we rehedged but poorer and wiser. We also took some profits to take some exposure off the table, taking respectable profits in the Dow and the QLD (QQQ leveraged ETF). If you look at the chart above you see that readers who manfully took their punishment during that previous period and ate their pickled peppers and pumpkins recovered all their equity. Lamentably that is the fate of patient trend following investors: their equity ebbs and flows in waves, just as market prices ebb and flow. We have some family accounts (for our sons) (nothing like Mitt’s, we assure you) where we exercise more patient investing and these are not hedged and will undoubtedly out perform our main account. Older…wiser? Bearing many scars, like an old raccoon which has been in many scrapes.
Well, at least we didn’t lose all that money in Apple. Of course we didn’t make all that money either, since we never got long, in spite of our admiration for Apple. Apple is a stock (you probably noticed) and we prefer ETFs to stocks since they don’t generally lose half their value (except in 2008-09 which is a black swan and everyone knows that black swans are 7 sigma events, except when they are 1 sigma events.) Why do the one hundred year events keep occurring during our threescore and ten? Why?
The trendline from December 31 (77 days) appears broken, though you always wait for confirmation. All our readers know what that means –probable nasty events to follow. Prices sit right on the Nov 16 trendline (109 days, m/l) . If that is broken more doom and gloom will result. But as Lemony Snickett says, look on the bright side. After the market gets finished with this rough patch it’s clear sailing to 1600 SPX. We will let you know when it’s time to double up.
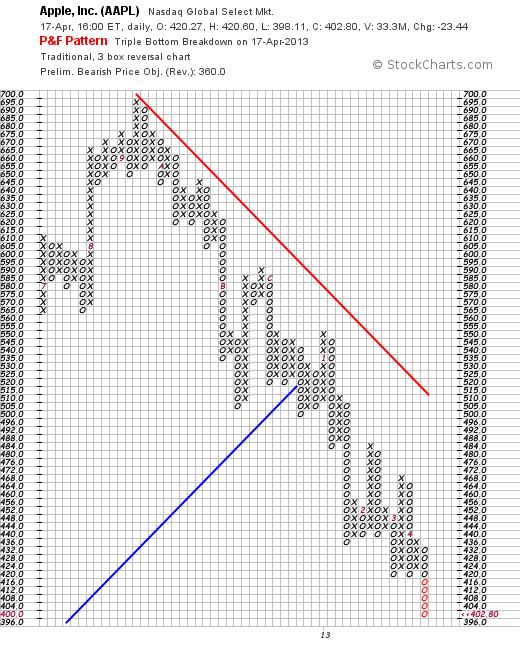
At least we have tools to deal with these unpleasant events. Below is one. The PnF chart of Apple which just cast off another PnF sell signal.
Sorry no link possible
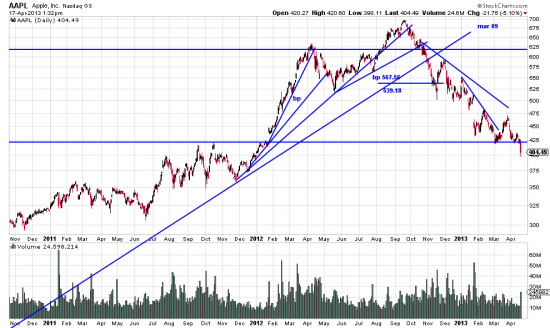
Today that system gave another signal and looked for a target of 360. We watch this with some interest as we will get long Apple when this bloodletting ends. The bar chart below:
http://stockcharts.com/h-sc/ui?s=AAPL&p=D&yr=2&mn=6&dy=0&id=p07894656172&a=256938322
As we have remarked before there were ample signs of trend reversal before the catastrophe, which you can see here. The PnF chart reflects the breakdown from support shown here — a so called triple bottom breakdown.
We spent many years in Boston and Cambridge. Our hearts go out to those injured in this senseless act of terrorism.