
http://stockcharts.com/h-sc/ui?s=%24SPX&p=D&yr=0&mn=6&dy=0&id=p38955316076&a=266398464
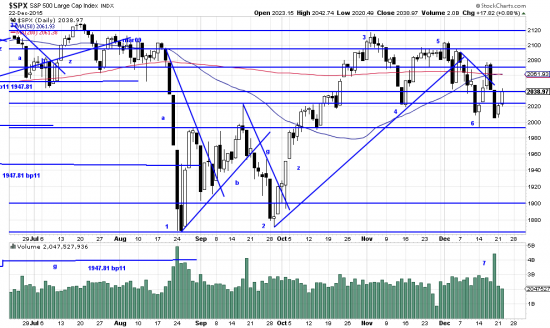
A careful examination of the formation here will not show an understandable pattern of higher highs and higher lows — or the opposite. What it shows is the chaos of modern machine and contrarian dominated trading. Nevertheless readers should be aware of the negative weight of the pattern.
The volume pattern around 1 casts a negative light over everything since then. A lower high is made at 3 and a higher low at 4. At 5 a lower high is made and at 6 a higher low. Thus, the last two months look decidedly bearish. The volume spike at 7 adds a further negative bit of evidence. What we think is happening here (entire chart) is machine trading run amok, reinforced by contrarian traders and perhaps errant hedge funds. But it doesn’t matter who or what caused the action here. What is important is that prudent investors look to their risks, which we think are to the downside rather than to the upside. You should especially be suspicious of those days which rocket upward. This is the market’s means of conditioning us — it is called variable interval of reinforcement. The entire context must be comprehended.
And the entire context here is questionable — and undecided, though slanted downward.
On a happier note: Merry Christmas. Happy New Year.