
http://stockcharts.com/h-sc/ui?s=%24SPX&p=D&yr=1&mn=0&dy=0&id=p42576269608
http://stockcharts.com/freecharts/pnf.php?c=%24SPX,PWTADANRBO[PA][D][F1!3!!!2!20]
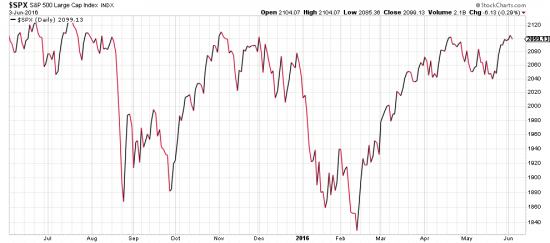
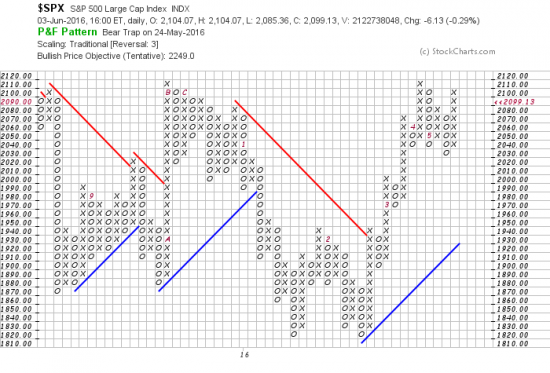
The market charts are a picture of stagnation and risk. While the PnF chart targets 2249 the totality of the chart for some 20 months is a massive top (?) or consolidation. These formations, especially of such length, store up energy like a volcano and eventually blow it off when the Fed makes a foolish move. They may be preparing to do that right now.
Not to mention the Brexit and the quiesent volatilities. We think the present situation has many more risks than opportunities; and would be in a defensive crouch at this point, if not totally hedged.
We will certainly let you know when it’s safe to go back in the water.