
http://stockcharts.com/h-sc/ui?s=%24SPX&p=D&yr=0&mn=6&dy=0&id=p70142979615&a=266398464
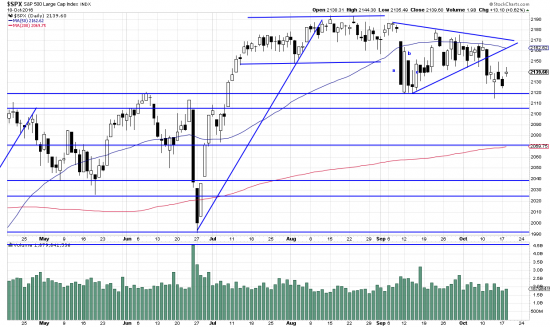
We have been watching closely as price fell out of the triangle. Under different circmstances we might have taken it as a short signal. But in the present context we completely discounted the action. The other major indices did not confirm. There was no confirmation or follow-through.) So once again the old principle is proven: The present trend tends to continue. The present trend is obviously sideways choppy, with contrarians in charge. The length and vigor of this trend are impressive. (Illustrating Keynes’ famous dictum: The market can remain irrational longer than you can remain solvent.
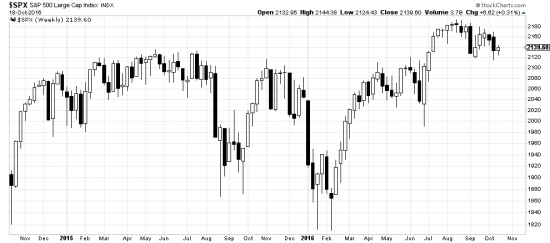
Here two years of sideways:
http://stockcharts.com/h-sc/ui?s=%24SPX&p=W&yr=2&mn=0&dy=0&id=p13264873553
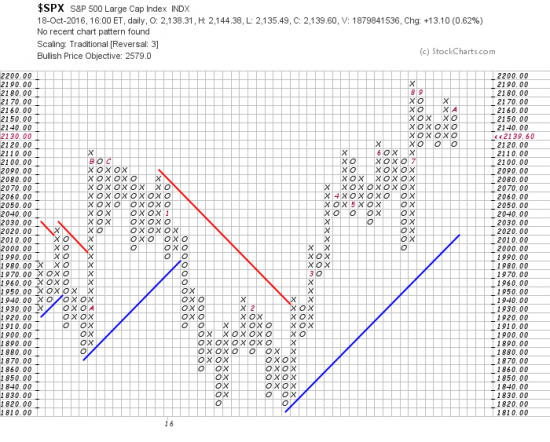
Classic sideways market with effort to break away. 2 years, weekly. These sideways markets build up powerful energy which propels the market a commensurate distance when the range is broken. The Point and Figure method attempts to measure this energy and it forecasts a target of 2579 in the present case:
http://stockcharts.com/freecharts/pnf.php?c=%24SPX,PWTADANRNO[PA][D][F1!3!!!2!20]
Incidentally — we will be taking a short position in the euro shortly. Worth consideration.