
http://schrts.co/CuWr77
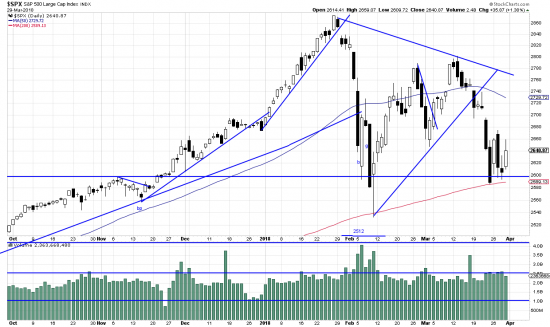
The interesting thing (and the maddening one) is that the present formation can be looked at from several viewpoints — none of them encouraging. There is a clear triangle whose interpretation would point toward a target of 2192 and whose implication is bearish. And there is another interpretation — that we are in a large alpha-beta-gamma pattern. We have hypothisized early on that there was an a-b-g pattern using shorter time frames–an initial a wave that bottomed at 2532, a 12 day be waveand an abortive g wave of 6 days. (time has disproved that analysis.): Now we could see an a wave of 9 days, a b wave of 22 days (more or less) with two wavelet highs in it and we are presently in the g wave (14 days). In this case we would look for a clear penetration of the downtrend line (the upper line of the triangle) to get long again. This would require an ascending wave at this point and we are still in the triangle breakdown wave.
The message is clear though complicated. Not a place to be buying. For our own accounts we have radically reduced our position –a time to be paring back on risk not making ill considered bets.