http://stockcharts.com/h-sc/ui?s=TLT&p=D&yr=1&mn=0&dy=0&id=p20970412253&a=203282126
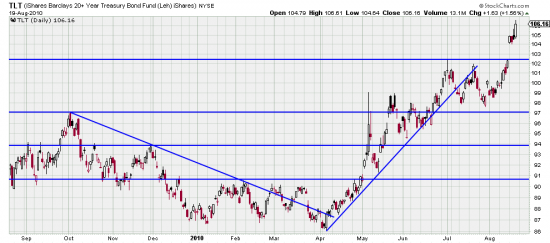
We had no sooner spoken of perhaps buying puts on the bonds (TLT bond etf, TBT short bond etf) that the WSJ published a squibb yesterday that someone came into the options market and bought 30,000 calls on the TBT (effectively a put on the T bond.)
10 cents will get you $10 that this is Taleb dreaming of black swans. It is a way to play it. but he’s only got (we think) 36 or 37 days for his bet to pay off. We think there is a distinct possibility that the bonds will break in this time but whatever you do in this market is playing with fire. We are thinking about the TBT calls right now and will comment soon.


Speaking of fire, this is the one market that the US federal reserve has unlimited firepower to peg, buying bonds at the long end of the curve at high prices with newly printed money to drive yields down. Can there be a collapse in prices at the long end of the US treasury curve in the QE era? Is Japan proof that forcing long-term interest rates toward zero can happen in the US, or in any major economic power, for years upon years, when a determined central bank monetizes its treasury?
From a technical standpoint expanding your chart back another year would bring into play additional upside resistance or upside targets. During the fall of 2008, the peak was around 115 and in early 2009 the last short upwave peaked around 110. Both had the parabolic characteristics we are seeing today. I concur with the Japanese analogy and believe it is a sound macro double check. At least when you buy puts you have a clear understanding of the risks of 100% loss at expiration if the trend continues to blow off.