
 http://stockcharts.com/h-sc/ui?s=TLT&p=D&yr=3&mn=7&dy=0&id=p07182475852&a=261274354
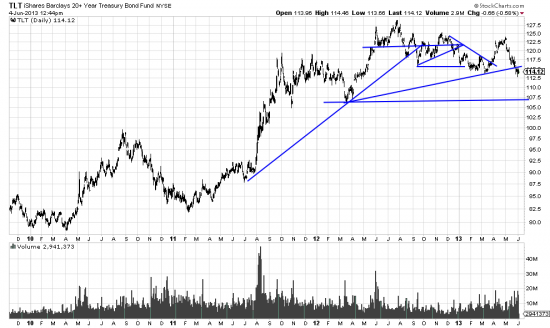
We have been saying for quite a while that bonds were a trap waiting to spring, and have been short for sometime. For family 529 accounts we just booted all the bond funds and switched to stock funds. (Unfortunately we can’t manage the capital ourselves. That would put the fund industry out of business, and they do a lot of business with Congress.) Then our colleague Blair Cummins pointed out the following chart to us. The break of the 15 month trendline would be enough to liquidate positions, and this picture completes the picture.
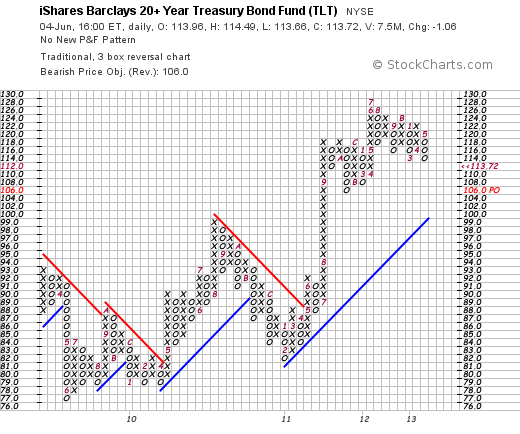
Looked at, at this scale (@humongous) (or @googopolous) the implications google the mind. It is more difficult to see in the top chart, but it is there. A monstrous top more than 20 months long. Here below the PnF chart, which because of the idiosyncrasies of point and figure charting does not see the potential disaster. It sees only the last leg of the formation.
 (sorry no link)
From that it projects a target of 106 in TLT. That, of course, could be the tip of the iceberg. (The one that sank the Titanic.)
Oh, and re the Hindenburg. If you think about it the Hindenburg was just a big bubble with a thick skin.
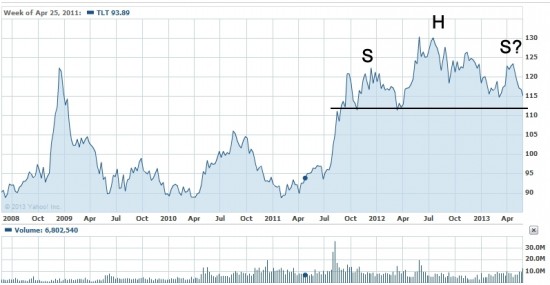
I am quite a novice as far as technical analysis is concerned, so has the head and shoulders pattern been broken yet?
Sorry. This note didn’t catch my attention before. looks to me like it is being broken at present (August) and I am amazed no one has noticed. I will post a letter on it.
cb